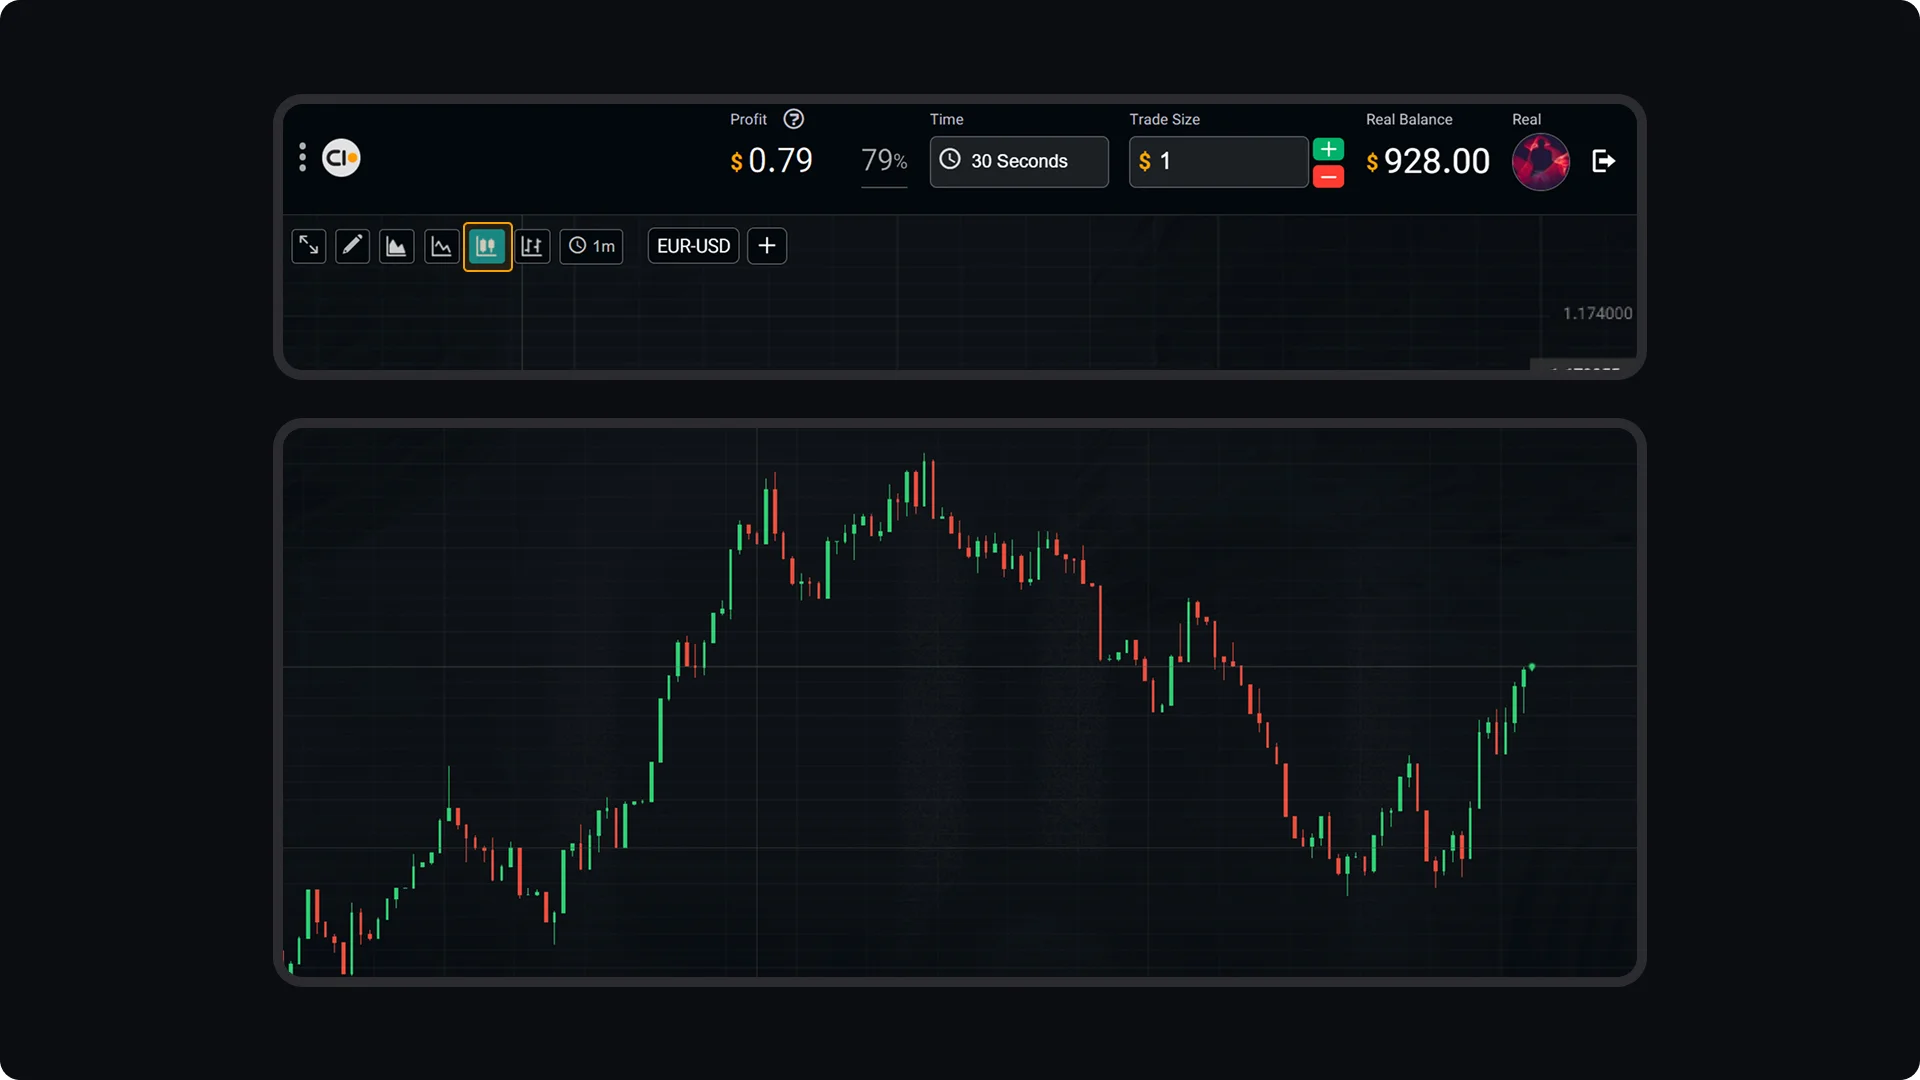
Candlestick charts are a fundamental tool in the Trading Room, offering traders a clear and detailed view of market trends and price movements. Each candlestick represents an asset's open, close, high, and low prices within a chosen timeframe, providing valuable insights into market activity. To activate this chart, traders should click on the specified tab, as shown in the accompanying image. The available timeframes include 5 seconds, 10 seconds, 30 seconds, and 1 minute, enabling traders to analyze short-term market fluctuations effectively.
CloseOption Tutorials
How to use CloseOption
How to Use Different Chart Types in the Trading Room