• First key support level of EUR/USD: 1.036869
• Second Key support level of EUR/USD: 1.028042
• Third Key support level of EUR/USD: 1.015282
• First key resistance level of EUR/USD: 1.043999
• Second Key resistance level of EUR/USD: 1.060967
• Third Key resistance level of EUR/USD: 1.076833
• First key support level of USD/CHF: 0.939853
• Second Key support level of USD/CHF: 0.937195
• Third Key support level of USD/CHF: 0.93
• First key resistance level of USD/CHF: 0.948099
• Second Key resistance level of USD/CHF: 0.952427
• Third Key resistance level of USD/CHF: 0.965479
• First key support level of GBP/USD: 1.18346
• Second Key support level of GBP/USD: 1.173818
• Third Key support level of GBP/USD: 1.164308
• First key resistance level of GBP/USD: 1.193631
• Second Key resistance level of GBP/USD: 1.20256
• Third Key resistance level of GBP/USD: 1.22
• First key support level of USD/JPY: 138.737865
• Second Key support level of USD/JPY: 137.796929
• Third Key support level of USD/JPY: 136.211049
• First key resistance level of USD/JPY: 140.623333
• Second Key resistance level of USD/JPY: 143.451348
• Third Key resistance level of USD/JPY: 145.052659
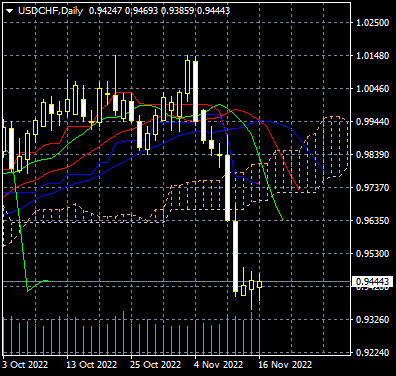
A price-oriented overview of the USD/CHF
During the last week, the USD/CHF went through a strong and uncorrected downward trend, during which the sellers managed to reach the lowest price level of 0.93575. On a monthly and weekly timeframe, there is no strong and clear reason for the price rise, and if the support level of 0.93575 is threatened and destroyed, the price will have the potential to fall further and reach the support levels of 0.927 and 0.92.
During its fall, the price stopped by reaching and touching the rising trend line consisting of two support points, which is confirmed by the important support level of 0.93700 and eventually leads to the formation of a price floor (used by some sellers to exit their trades).
The price floor formed in the daily timeframe has two candlesticks with the Spinning Top Pattern (indecision to continue the trend) and the reverse hammer Pattern (weak warning to create a price floor), which have issued a moderate warning to weaken the downward trend. Since the price is oversold in the weekly and daily timeframes, the price will have the potential to rise and correct the downward trend, however little, during the following candles in the daily timeframe. If the price increases, buyers will try to take the resistance levels of 0.947 and then up to 0.9655.


