An overview of important support and resistance levels of the four major currency pairs of the ongoing week.
• First key support level of EUR/USD: 1.08882
• Second Key support level of EUR/USD: 1.08479
• Third Key support level of EUR/USD: 1.07950
• First key resistance level of EUR/USD: 1.09538
• Second Key resistance level of EUR/USD: 1.1000
• Third Key resistance level of EUR/USD: 1.10685
• First key support level of USD/CHF: 0.86079
• Second Key support level of USD/CHF: 0.85379
• Third Key support level of USD/CHF: 0.83999
• First key resistance level of USD/CHF: 0.86421
• Second Key resistance level of USD/CHF: 0.87000
• Third Key resistance level of USD/CHF: 0.87483
• First key support level of GBP/USD: 1.30456
• Second Key support level of GBP/USD: 1.30000
• Third Key support level of GBP/USD: 1.28650
• First key resistance level of GBP/USD: 1.31740
• Second Key resistance level of GBP/USD: 1.32670
• Third Key resistance level of GBP/USD: 1.34200
• First key support level of USD/JPY: 148.843
• Second Key support level of USD/JPY: 147.339
• Third Key support level of USD/JPY: 145.980
• First key resistance level of USD/JPY: 150.049
• Second Key resistance level of USD/JPY: 150.680
• Third Key resistance level of USD/JPY: 152.022
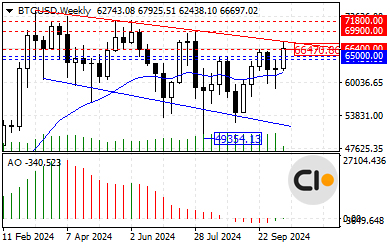
A Review of Bitcoin’s Status as of October 15, 2024
Since the beginning of the previous month, Bitcoin has experienced a significant increase of approximately $8,000, with buyers managing to push the price to a peak of $66,470 during this upward trend. Based on the current price movements, there is no clear or compelling reason for a long-term price decline in monthly or weekly timeframes. Instead, the price appears to be attempting to reach its historical peak in this crucial cryptocurrency market.
Should the upward trend continue, buyers are likely aiming for crucial resistance levels at $69,900, followed by $71,800. (The formation of long lower shadows in the past three monthly candlesticks, as well as the spinning top pattern from last week, indicates buyers’ inclination toward these levels.)
In shorter timeframes, such as daily and 4-hour, the price has stalled near the resistance level of $66,400, temporarily halting further upward movement. On the 4-hour chart, the formation of a doji candlestick, confirmed by a bearish candle below the $66,400 level, suggests a potential for a pause in the upward trend. If the price drops further from this resistance level, the next support range lies between $65,000 and $64,450.
Given the current market conditions, the first significant signal for the continuation of the upward trend will be issued if the $66,400 resistance level is broken and the price stabilises above this level.
The CloseOption Team


