The key support and resistance level ahead for EUR/USD are as follows:
- R3: 1.18200
- R2: 1.17900
- R1: 1.17520
- S1: 1.17180
- S2: 1.16820
- S3: 1.16350
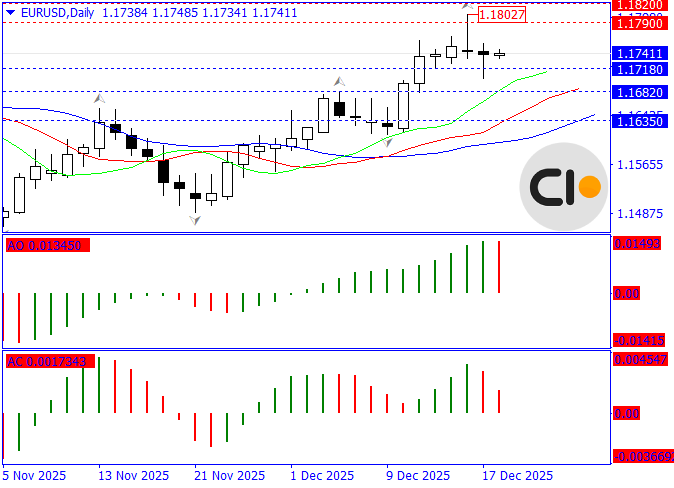
EUR/USD Market Overview – December 17, 2025
Over the past few weeks, the EUR/USD pair has moved in an upward trend. During this move, buyers were able to push the price up to 1.18027. On higher timeframes, such as the weekly chart, the trend is still considered bullish.
However, price is currently testing the key resistance zone between 1.17900 and 1.18200 and has not been able to break above it so far. In general, failing to break this resistance area points to the possibility of a correction and a decline in the coming candles.
From a fundamental point of view, traders are still waiting for important US economic data, especially employment and inflation numbers, to gain a clearer view of the Federal Reserve’s plans in the months ahead. Some analysts also believe that the Federal Reserve may introduce further interest rate cuts in early 2026. If this happens, pressure on the US dollar is likely to increase.
On the other hand, the economic situation in Europe, and particularly in Germany as the strongest economy in the Eurozone, has not been positive in recent surveys and continues to face serious challenges. This has kept the euro under pressure and has become one of the reasons behind the current declines in the EUR/USD pair.
On shorter timeframes such as the daily chart, price has stopped rising after reaching the resistance zone. The formation of a doji candlestick shows buyer hesitation and a pullback in momentum. If price holds below the 1.17180 support level, a corrective move toward 1.16820 is possible, and in a stronger move, price may fall toward 1.16350.
In the opposite, bullish scenario, the first warning comes when price moves above the 1.17520 resistance level. If the key level at 1.17900 is broken, bearish pressure weakens, and potential upside targets for buyers are located at 1.18200 and 1.18600.


