An overview of important support and resistance levels of the four major currency pairs of the ongoing week.
• First key support level of EUR/USD: 1.06000
• Second Key support level of EUR/USD: 1.05500
• Third Key support level of EUR/USD: 1.05100
• First key resistance level of EUR/USD: 1.06290
• Second Key resistance level of EUR/USD: 1.06600
• Third Key resistance level of EUR/USD: 1.06820
• First key support level of USD/CHF: 0.88271
• Second Key support level of USD/CHF: 0.88052
• Third Key support level of USD/CHF: 0.87730
• First key resistance level of USD/CHF: 0.88400
• Second Key resistance level of USD/CHF: 0.88727
• Third Key resistance level of USD/CHF: 0.88997
• First key support level of GBP/USD: 1.27300
• Second Key support level of GBP/USD: 1.26650
• Third Key support level of GBP/USD: 1.26200
• First key resistance level of GBP/USD: 1.28400
• Second Key resistance level of GBP/USD: 1.28940
• Third Key resistance level of GBP/USD: 1.3000
• First key support level of USD/JPY: 154.535
• Second Key support level of USD/JPY: 153.900
• Third Key support level of USD/JPY: 153.100
• First key resistance level of USD/JPY: 155.390
• Second Key resistance level of USD/JPY: 156.000
• Third Key resistance level of USD/JPY: 156.627
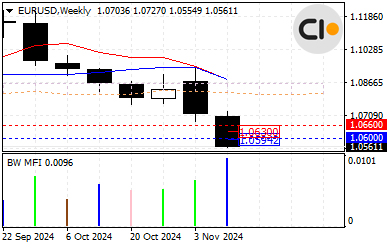
EUR/USD and Strong Decline!
Over the past few days, EUR/USD has been under pressure due to internal U.S. issues and a strengthening dollar, resulting in a significant downtrend. Sellers, during this bearish cycle, successfully reached the lowest price level of 1.05942.
The price, during its decline, encountered a key support level at 1.06000, which halted further decrease and led to a slight correction thus far. Observing the long-term charts, such as the monthly and weekly ones, no clear or convincing signs of a price increase have emerged yet. Should the critical level of 1.06 be breached, the price has the potential to decline further, possibly reaching the support level at 1.051.
In shorter timeframes, like the daily and 4-hour charts, the price appears to be in an oversold state. A gradual rise from the 1.06 level indicates that some conservative sellers might be exiting their positions.
Examining the price movement from the high of 1.09357 to the current decline, a harmonic pattern of the AB=CD type is forming. If this pattern completes at point D, it may attract the attention of potential buyers.
In general, the price could remain under selling pressure. The first sign of a more substantial corrective move would be the break of the resistance level at 1.063, which would then set the stage for a potential rise towards the 1.066 resistance level.
The CloseOption Team


