An overview of the status of the EUR/USD currency pair on 19/10/2023.An overview of important support and resistance levels of the four major currency pairs of the ongoing week.
• First key support level of EUR/USD: 1.052547
• Second Key support level of EUR/USD: 1.049507
• Third Key support level of EUR/USD: 1.045184
• First key resistance level of EUR/USD: 1.055723
• Second Key resistance level of EUR/USD: 1.059417
• Third Key resistance level of EUR/USD: 1.063483
• First key support level of USD/CHF: 0.895512
• Second Key support level of USD/CHF: 0.890034
• Third Key support level of USD/CHF: 0.882418
• First key resistance level of USD/CHF: 0.900845
• Second Key resistance level of USD/CHF: 0.903155
• Third Key resistance level of USD/CHF: 0.908465
• First key support level of GBP/USD: 1.210697
• Second Key support level of GBP/USD: 1.205285
• Third Key support level of GBP/USD: 1.2
• First key resistance level of GBP/USD: 1.216254
• Second Key resistance level of GBP/USD: 1.221138
• Third Key resistance level of GBP/USD: 1.230841
• First key support level of USD/JPY: 149.436845
• Second Key support level of USD/JPY: 148.416364
• Third Key support level of USD/JPY: 147.337772
• First key resistance level of USD/JPY: 149.940588
• Second Key resistance level of USD/JPY: 150.16451
• Third Key resistance level of USD/JPY: 151
An overview of the status of the EUR/USD currency pair on 19/10/2023.
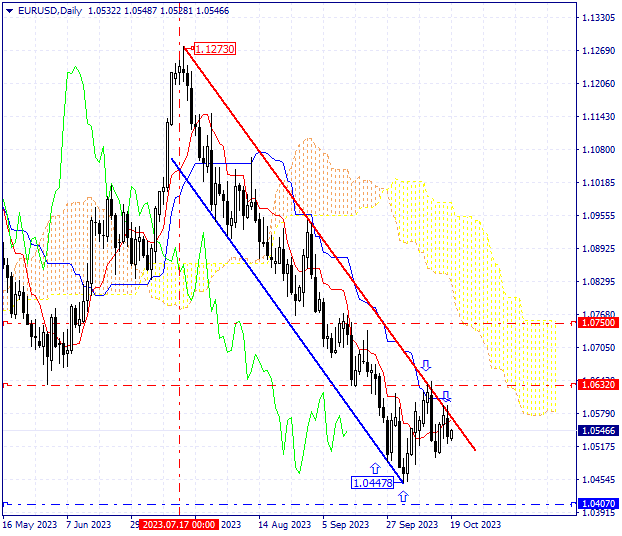
The EUR/USD currency pair has been in a strong downtrend since mid-July with minor corrections. Sellers have managed to hit a low of 1.04478. Currently, according to the status of the monthly chart, there is no clear and transparent reason for the price to rise. If the current support levels are broken, the price will have the potential to fall further and reach the important level of 1.04070, and then possibly down to 1.02000. (Warning for buyers with medium-term transactions)
In the shorter term, such as the weekly timeframe, patterns like hammer and inverted hammer have formed over the past two weeks. These patterns indicate a weakening of the downward trend and the formation of a price floor in this area.
The price is oversold in this timeframe, suggesting a potential for upside movement in the next candlesticks, although this potential is weak.
In the daily timeframe, the price is following a descending channel pattern. The resistance and support lines of this pattern have been the most influential technical factors in determining price ceilings and floors over the last month. Recent climbs on the 10th and 11th, as well as on the 16th and 17th, have been halted after reaching the resistance line of this pattern. The price has not managed to break this line so far. The breaking of this resistance line would be a positive signal for buyers, indicating potential for further upward movement towards the resistance levels of 1.06320 and, in a more significant form, up to 1.07500.
CloseOption Team


