An overview of important support and resistance levels of the four major currency pairs of the ongoing week.
• First key support level of EUR/USD: 1.08
• Second Key support level of EUR/USD: 1.07778
• Third Key support level of EUR/USD: 1.07440
• First key resistance level of EUR/USD: 1.08112
• Second Key resistance level of EUR/USD: 1.08380
• Third Key resistance level of EUR/USD: 1.08716
• First key support level of USD/CHF: 0.865
• Second Key support level of USD/CHF: 0.861424
• Third Key support level of USD/CHF: 0.855659
• First key resistance level of USD/CHF: 0.86694
• Second Key resistance level of USD/CHF: 0.87039
• Third Key resistance level of USD/CHF: 0.879
• First key support level of GBP/USD: 1.29448
• Second Key support level of GBP/USD: 1.28948
• Third Key support level of GBP/USD: 1.28500
• First key resistance level of GBP/USD: 1.30000
• Second Key resistance level of GBP/USD: 1.30593
• Third Key resistance level of GBP/USD: 1.31423
• First key support level of USD/JPY: 150.600
• Second Key support level of USD/JPY: 150.320
• Third Key support level of USD/JPY: 149.420
• First key resistance level of USD/JPY: 151.060
• Second Key resistance level of USD/JPY: 151.890
• Third Key resistance level of USD/JPY: 153.200
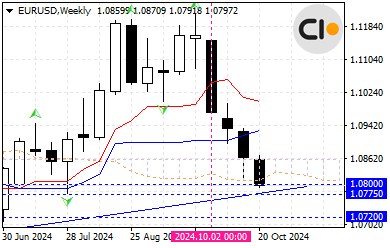
Overview of the EUR/USD Situation as of October 22, 2024
As mentioned in the previous analysis of the EUR/USD currency pair dated October 2, 2024, the technical indicators present in the chart suggested that the price had the potential to decline, which ultimately occurred. Over the past three weeks, the EUR/USD has been in a downtrend, during which sellers managed to reach the lowest price level of 1.080552 so far.
Currently, from a long-term perspective, such as weekly analysis, there is no clear and obvious reason for a price increase. For a trend reversal to occur, at least the necessary signs must form on this chart.
In shorter time frames, such as daily and 4-hour charts, the prevailing trend is bearish, and the price is approaching a significant support level at 1.08000, which currently serves as the most critical price barrier against further declines.
If traders break through the key level of 1.08000, the price has the potential for further declines, reaching the support level of 1.07750 in the short term. (Another support level that could influence the price is an upward trend line formed by three price lows, which can be observed on daily or weekly charts.)
Conversely, in an upward scenario, if the price remains in an oversold condition and does not break below the 1.08000 level, the potential for a correction in the downward trend increases, prompting high-risk buyers to begin their activities.
The CloseOption Team


