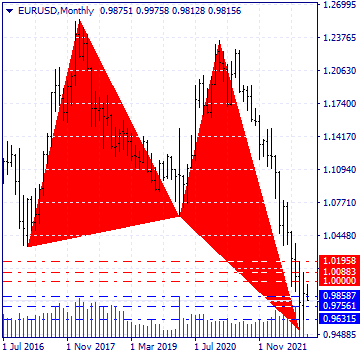
• First key support level of EUR/USD: 0.985867
• Second Key support level of EUR/USD: 0.975609
• Third Key support level of EUR/USD: 0.963151
• First key resistance level of EUR/USD: 1
• Second Key resistance level of EUR/USD: 1.008833
• Third Key resistance level of EUR/USD: 1.019576
• First key support level of USD/CHF: 0.991399
• Second Key support level of USD/CHF: 0.985
• Third Key support level of USD/CHF: 0.977702
• First key resistance level of USD/CHF: 1
• Second Key resistance level of USD/CHF: 1.005204
• Third Key resistance level of USD/CHF: 1.014698
• First key support level of GBP/USD: 1.143843
• Second Key support level of GBP/USD: 1.126813
• Third Key support level of GBP/USD: 1.1
• First key resistance level of GBP/USD: 1.162317
• Second Key resistance level of GBP/USD: 1.17377
• Third Key resistance level of GBP/USD: 1.190391
• First key support level of USD/JPY: 145.121461
• Second Key support level of USD/JPY: 143.349139
• Third Key support level of USD/JPY: 140.339401
• First key resistance level of USD/JPY: 148.527303
• Second Key resistance level of USD/JPY: 150.40161
• Third Key resistance level of USD/JPY: 151.934757
EUR/USD and a point to return!
The EUR/USD chart has been in a strong and consistent downtrend since the beginning of 2021, with sellers succeeding in reaching the lowest price level of 0.953867. In the long-term periods, such as monthly and weekly, the price is wholly oversold due to the recent strong declines, and the potential to stop the downward trend or weaken it during the next candles is pointed out.
According to the type of price movements formed in the monthly interval between the price ceiling of 1.25625 and the price floor of 0.95387, an ideal harmonic pattern of the butterfly type has been created, which is completed by the D point of this pattern, warning (long-term warning) the rise and rise of the price will be noted during the upcoming candles. (With the formation of the Spinning candlestick pattern in the previous month, it shows the traders’ lack of decision to go up or down, which can be considered a good point to reduce selling pressure)
In the daily time frame, in line with the longer-term time frames, a bullish signal has been issued with the breaking of the downward trend line (with five resistance points), which buyers are looking for open points and buying opportunities in the support band between 0.98000 and 0.98537.
CloseOption Team
www.closeoption.com


