
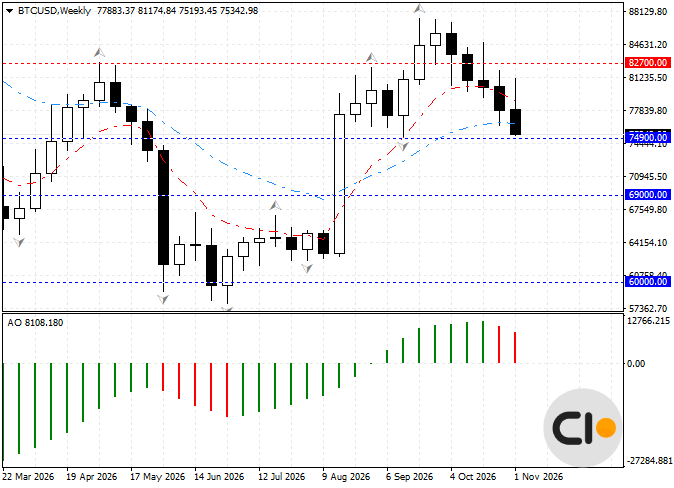
The key support and resistance levels ahead for BTC/USD are as follows:
- Third key resistance level of BTC/USD: 85800
- Second key resistance level of BTC/USD: 82700
- First key resistance level of BTC/USD: 80000
- First key support level of BTC/USD: 75000
- Second key support level of BTC/USD: 72500
- Third key support level of BTC/USD: 69000
Bitcoin | The Iran War and the U.S. Elections
Bitcoin‘s price action over the past four weeks has been entirely dominated by sellers, with a cycle low of $75,201 recorded so far.
Bitcoin Fundamental Analysis
The Democrats’ victory in the U.S. midterm elections has placed Bitcoin between two opposing developments: hopes for an end to the Iran–U.S. war and growing uncertainty surrounding the future regulatory framework for cryptocurrencies.
The more than 8% decline in oil prices following the elections reflected expectations of easing tensions in the Middle East. However, continued threats to oil tankers in the Strait of Hormuz suggest that the market has already priced in some reduction in geopolitical risk ahead of any actual peace agreement. Nevertheless, oil prices remain approximately 64% higher than at the beginning of the year. This has intensified concerns about persistent inflation and slowing economic growth, making the Federal Reserve’s decision-making process increasingly challenging.
Against this backdrop, even a decline in Treasury yields does not necessarily signal improving liquidity conditions. The 5.5% drop in the Nasdaq, alongside the simultaneous decline in Bitcoin, also points to growing risk aversion across financial markets.
Bitcoin‘s initial post-election rebound was driven primarily by the unwinding of short positions rather than an increase in spot buying demand. This is consistent with the $74.6 million in net inflows into Bitcoin exchange-traded funds (ETFs) on November 4, followed by $430.2 million in net outflows the following day.
On-chain data also indicate that, although the reduction in trading leverage has helped eliminate some of the accumulated risk, the decline in the share of short-term investors’ holdings that remain in profit to approximately 38% continues to highlight the market’s fragility. At the same time, uncertainty surrounding proposed crypto market structure legislation and the security implications of the Binance hack have increased investment risks across the industry, although the impact of regulatory changes will not be uniform across Bitcoin and other cryptocurrencies.
Overall, the market’s fundamental challenge lies in the gap between improving political expectations and actual capital flows. This gap is unlikely to close without a sustained reduction in geopolitical tensions, easing inflationary pressures, and a recovery in institutional demand.
Until then, a decline in fear should not be mistaken for the beginning of a sustained fundamental recovery.
Bitcoin Price Action Analysis
On higher timeframes, including the weekly chart, Bitcoin remains in a downtrend after failing to break decisively above the $82,700 resistance level, resulting in a failed breakout.
Given the sequence of bearish candles and the absence of a clear bullish signal from the Stochastic (8,3,3) indicator, no convincing signal of an upward move has emerged so far.
However, one key point to watch is the price’s proximity to the important $75,000 level. This level, combined with oversold conditions, could provide solid support and help prevent further downside. This is particularly relevant on shorter timeframes, such as the 4-hour chart, where it could trigger modest and short-lived upward moves.
Accordingly, provided that the $75,000 support level holds, Bitcoin has the potential to move higher toward the $80,000 resistance level.
Conversely, if further selling pressure emerges due to fundamental factors and the current support level is breached, Bitcoin could extend its decline toward the next support level at $72,500.