Bitcoin Technical Analysis – An overview of important support and resistance levels of the four major currency pairs of the ongoing week.
• First key support level of EUR/USD: 1.080949
• Second Key support level of EUR/USD: 1.075
• Third Key support level of EUR/USD: 1.07
• First key resistance level of EUR/USD: 1.09
• Second Key resistance level of EUR/USD: 1.093539
• Third Key resistance level of EUR/USD: 1.095563
• First key support level of USD/CHF: 0.897806
• Second Key support level of USD/CHF: 0.894911
• Third Key support level of USD/CHF: 0.891999
• First key resistance level of USD/CHF: 0.902561
• Second Key resistance level of USD/CHF: 0.9059
• Third Key resistance level of USD/CHF: 0.91
• First key support level of GBP/USD: 1.244496
• Second Key support level of GBP/USD: 1.237
• Third Key support level of GBP/USD: 1.227728
• First key resistance level of GBP/USD: 1.254
• Second Key resistance level of GBP/USD: 1.2578
• Third Key resistance level of GBP/USD: 1.266823
• First key support level of USD/JPY: 137
• Second Key support level of USD/JPY: 135.501704
• Third Key support level of USD/JPY: 133.715
• First key resistance level of USD/JPY: 137.799438
• Second Key resistance level of USD/JPY: 138.8
• Third Key resistance level of USD/JPY: 140
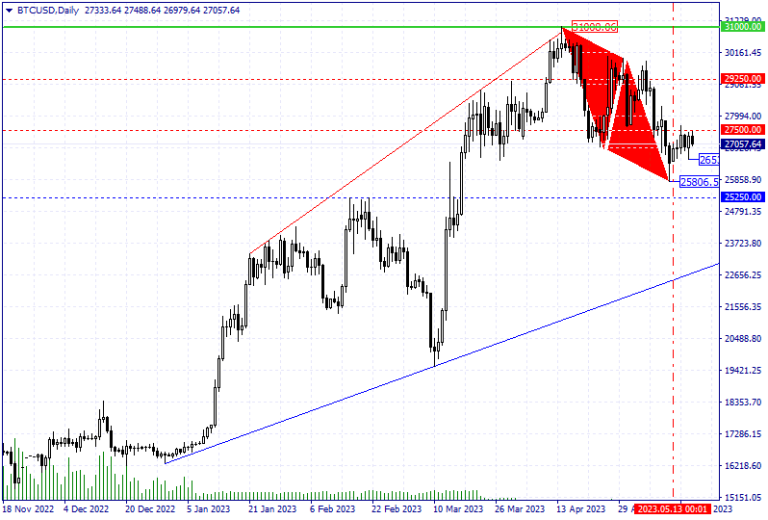
Bitcoin Technical Analysis – An overview of Bitcoin status on 17/05/2023
Bitcoin’s recent upward trend hit a roadblock when it reached the $31,000 round resistance level. As a result, it has been correcting its previous upward moves in the past few weeks. The oversold state has ended based on the price movements observed over more extended periods like monthly and weekly. However, slight declines and downward corrections are still possible due to traders’ hesitation regarding price direction.
Given this situation, buyers should be cautious. If the support level of $25,806.52 is breached, there is potential for the price to fall further and reach critical support levels of $25,000 and, in the next step, up to $21,500.
Over the daily and 4-hour timeframes, the price has been experiencing a decline from the resistance level of 31,000. However, a price floor at 25,806.52 has recently formed, which has weakened this downtrend.
Based on the price ceiling of 31008.06 and the price floor of 25806.52, there seems to be an AB=CD harmonic pattern with ratios of 76.4 and 127.2. This pattern suggests a rising signal from the 13th day, which has proven effective thus far. However, on the 16th day, the price experienced a downward trend throughout the day. Currently, it appears that this decline has tapered off.
The Morning Star candlestick pattern indicates that buyers have established a stable price floor of $26536.89 per hour. They are working to prevent further price drops and maintain a consistent floor by setting fixed prices.
Based on market trends, the price can increase if a price floor is established within a 4-hour timeframe and buyers enter the market. However, this could result in the price reaching resistance levels of $27,500 and even up to $29,250.
CloseOption Team


