• First key support level of EUR/USD: 1.083603
• Second Key support level of EUR/USD: 1.076456
• Third Key support level of EUR/USD: 1.06
• First key resistance level of EUR/USD: 1.092516
• Second Key resistance level of EUR/USD: 1.1
• Third Key resistance level of EUR/USD: 1.107469
• First key support level of USD/CHF: 0.916784
• Second Key support level of USD/CHF: 0.912928
• Third Key support level of USD/CHF: 0.909013
• First key resistance level of USD/CHF: 0.927916
• Second Key resistance level of USD/CHF: 0.934507
• Third Key resistance level of USD/CHF: 0.94
• First key support level of GBP/USD: 1.226027
• Second Key support level of GBP/USD: 1.216862
• Third Key support level of GBP/USD: 1.2
• First key resistance level of GBP/USD: 1.239607
• Second Key resistance level of GBP/USD: 1.244716
• Third Key resistance level of GBP/USD: 1.266833
• First key support level of USD/JPY: 129.130037
• Second Key support level of USD/JPY: 127.317022
• Third Key support level of USD/JPY: 126.325599
• First key resistance level of USD/JPY: 130
• Second Key resistance level of USD/JPY: 131.114944
• Third Key resistance level of USD/JPY: 132.7
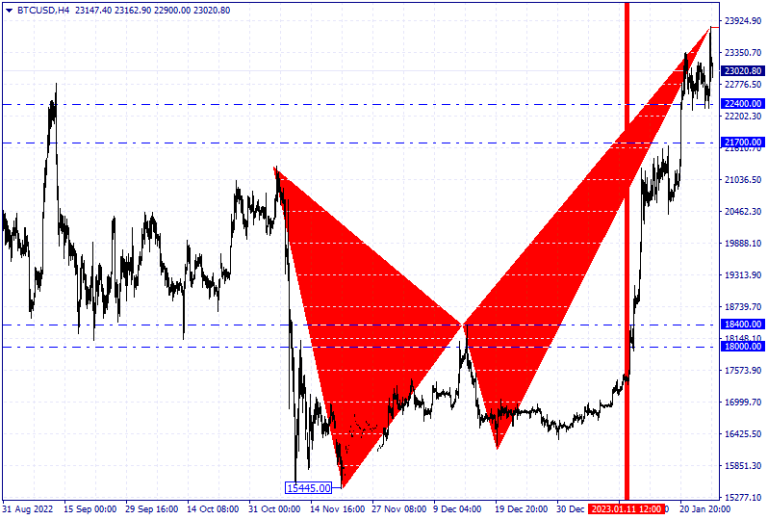
Bitcoin Technical Analysis on 25/01/2023
As stated in the previous Bitcoin analysis on 11/01/2023, the price had the potential to rise and increase, and finally, the buyers achieved two price targets of $18,000 and $18,400. During this upward trend, buyers have obtained the highest price level of $23811, which is now the closest resistance level ahead.From a long-term point of view and examining price movements in long-term intervals such as monthly and weekly, no clear and transparent reason for price reduction can be seen, and the first strong warning to pay attention to the downward wave is issued when the support level of $15,500 is broken. (long-term traders)
With its recent substantial rise in shorter periods, such as daily and 4-hour prices, it is in a state of overbuying. Because the price is oversold and the negative divergence of the price with the stock index, there is a potential to stop the rise and fall of the price.Regarding the type of price movements, which it has been formed between the price floor ($15445), and the current price rise, a non-ideal butterfly-type harmonic pattern is forming. And if a price ceiling is found in the daily period (point D) during the next candles, it warns of a price reduction or a temporary difficulty. In general, given the current quite ascending conditions (warning to sellers) that exist, if a price ceiling occurs in the daily or 4 hours time frame and stabilizes it, the potential correction price will have an ascending trend to the support level (22400) and then to $21700.
CloseOption Team
www.closeoption.com


