Cardano digital currency – An overview of important support and resistance levels of the four major currency pairs of the ongoing week.
• First key support level of EUR/USD: 1.03284
• Second Key support level of EUR/USD: 1.02244
• Third Key support level of EUR/USD: 1.01276
• First key resistance level of EUR/USD: 1.03916
• Second Key resistance level of EUR/USD: 1.04773
• Third Key resistance level of EUR/USD: 1.06
• First key support level of USD/CHF: 0.94046
• Second Key support level of USD/CHF: 0.93695
• Third Key support level of USD/CHF: 0.93
• First key resistance level of USD/CHF: 0.95959
• Second Key resistance level of USD/CHF: 0.97
• Third Key resistance level of USD/CHF: 0.98400
• First key support level of GBP/USD: 1.19482
• Second Key support level of GBP/USD: 1.17788
• Third Key support level of GBP/USD: 1.1643
• First key resistance level of GBP/USD: 1.20813
• Second Key resistance level of GBP/USD: 1.21484
• Third Key resistance level of GBP/USD: 1.22
• First key support level of USD/JPY: 137.62
• Second Key support level of USD/JPY: 136.25
• Third Key support level of USD/JPY: 135.65
• First key resistance level of USD/JPY: 139.35
• Second Key resistance level of USD/JPY: 140.738
• Third Key resistance level of USD/JPY: 142.170
An overview of the status of Cardano digital currency.
Cardano digital currency has been in a solid downtrend without significant correction since its historical high of $2.96, and the price has reached $0.280 during this downward trend. Considering that altcoins are affected by the main leader Bitcoin and also the current negative issue in the crypto market (FTX exchange), if the support range of $0.30 is lost, the price has the potential to fall further and reach the support level of 0.25 and in it will continue up to $0.2. (Warning for long-term and medium-term buyers)
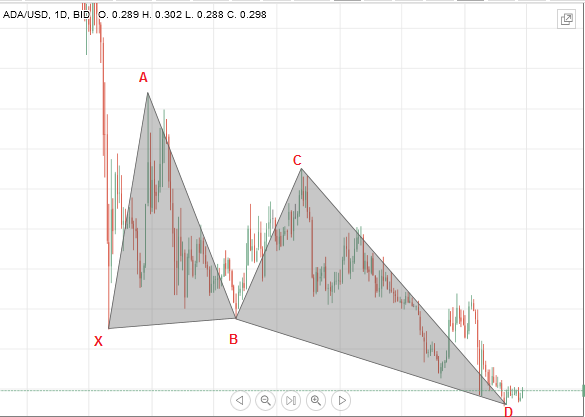
In the weekly time frame, according to the type of price movements formed from the price ceiling of $0.66 to the price floor of $0.28, a harmonic technical pattern of the butterfly type has been taken in this Schegel chart, which, with the completion of the D point, is a warning of an increase and a change in the direction of the trend has been issued.
The formation of the ascending star candlestick pattern shows the equality between buyers and sellers, which shows the potential for the formation of a price floor and the subsequent ascent, albeit partial. Because the price is oversold in the long-term, such as monthly and weekly, the price will have the potential to rise and increase, though slightly, during the next candles. According to the above scenario, if the price increases, the buyers will initially seek to reach the level of $0.327 and then reach the critical resistance level of $0.4.
CloseOption Team
www.closeoption.com
 das Perspectivas Financeiras")

")
