An overview of Ethereum status on 08/11/2023 – An overview of important support and resistance levels of the four major currency pairs of the ongoing week.
• First key support level of EUR/USD: 1.06353
• Second Key support level of EUR/USD: 1.05300
• Third Key support level of EUR/USD: 1.04843
• First key resistance level of EUR/USD: 1.06989
• Second Key resistance level of EUR/USD: 1.0727
• Third Key resistance level of EUR/USD: 1.08603
• First key support level of USD/CHF: 0.89922
• Second Key support level of USD/CHF: 0.89571
• Third Key support level of USD/CHF: 0.89068
• First key resistance level of USD/CHF: 0.90247
• Second Key resistance level of USD/CHF: 0.90657
• Third Key resistance level of USD/CHF: 0.9148
• First key support level of GBP/USD: 1.224394
• Second Key support level of GBP/USD: 1.212409
• Third Key support level of GBP/USD: 1.207123
• First key resistance level of GBP/USD: 1.233198
• Second Key resistance level of GBP/USD: 1.242181
• Third Key resistance level of GBP/USD: 1.258791
• First key support level of USD/JPY: 150.324
• Second Key support level of USD/JPY: 150.000
• Third Key support level of USD/JPY: 149.323502
• First key resistance level of USD/JPY: 150.980843
• Second Key resistance level of USD/JPY: 151.684
• Third Key resistance level of USD/JPY: 152.000
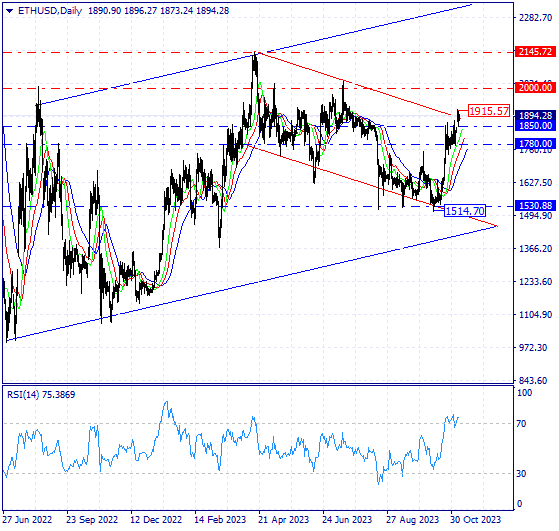
An overview of Ethereum status on 08/11/2023.
Ethereum has been on an upward trend for the past two months, with buyers pushing the price to its highest level at 1915.57.
There seems to be no reason for a price decrease based on long-term movements such as monthly and weekly. If the current resistance level is removed, this crypto will have the ability to climb further and reach the resistance levels of $2000 and then up to $2145.
In shorter periods, such as daily, the price cannot rise further by reaching the downward trend line of two resistance points. The previous day’s formation of a Spinning top candlestick pattern suggests a potential weakening of the upward trend.
In the 4-hour time frame, due to the recent frequent price rises, the price has diverged with the RSI index, which indicates the possibility of price suffering or price reduction during the next candlesticks.
In regards to this, the initial indication for a rise in this cryptocurrency is the break of the upward trend line. On the other hand, for the downward trend in general, as long as the price ceiling of $1915.57 is standing, the price has the potential to correct the upward trend to the support level 1850. And then it will have up to 1780 dollars.
CloseOption Team


