The key support and resistance levels ahead for BTC/USD are as follows:
- R3: 117000
- R2: 115000
- R1: 112000
- S1: 107500
- S2: 104000
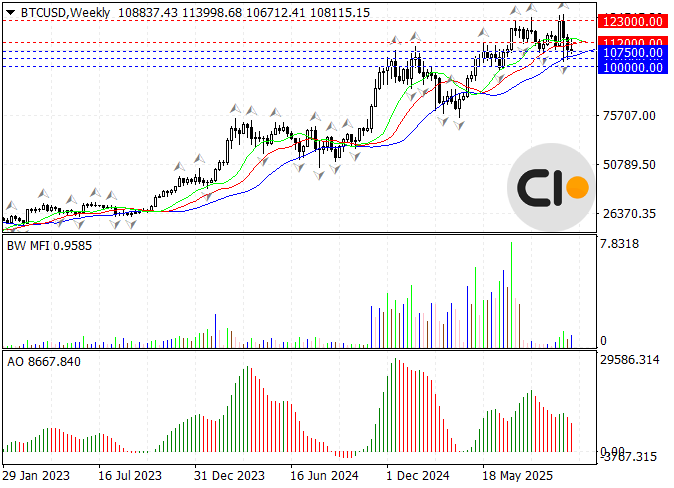
- S3: 100000
A Major Downturn Commencing in the Crypto Market?
As noted in our previous Bitcoin analysis of October 15, 2025, the chart’s technical posture suggested a high potential for a correction, a scenario that has since materialized.
For the third consecutive month, Bitcoin has pulled back from its parabolic rise. This period of stagnation has, on the whole, instilled a degree of fear among buyers. On long-term timeframes, such as the monthly and weekly charts, the prevailing trend is still interpreted as bullish. Nevertheless, due to the price being in an overbought state—as well as a notable divergence with the RSI and other technical indicators—initiating new buy positions may carry significant risk.
Should prices fail to appreciate, market sentiment may increasingly align with the view that a significant top has been formed, highlighting a general weakness in Bitcoin. This could provide the catalyst for the current stagnation to evolve into a full-scale sell-off.
On shorter timeframes, such as the daily and 4-hour charts, Bitcoin is currently in a corrective phase, and ideal conditions for a bullish move have not yet materialized. The formation of a “Spinning Top” candlestick pattern on the 21st signifies market indecision and the subsequent stalling of the recent upward momentum. If this correction deepens, traders will be closely monitoring the psychological $100,000 level, which is poised to act as a key support.
Conversely, in a bullish scenario, the first significant signal for an upward move would be a decisive break and hold above the key $112,000 level. This would restore optimism among buyers. In such an event, their initial target would be the $115,000 resistance, with a more extended move targeting $117,000.


