• First key support level of EUR/USD: 0.981181
• Second Key support level of EUR/USD: 0.964067
• Third Key support level of EUR/USD: 0.954433
• First key resistance level of EUR/USD: 0.987421
• Second Key resistance level of EUR/USD: 0.999633
• Third Key resistance level of EUR/USD: 1.004985
• First key support level of USD/CHF: 0.991824
• Second Key support level of USD/CHF: 0.986
• Third Key support level of USD/CHF: 0.978518
• First key resistance level of USD/CHF: 0.997397
• Second Key resistance level of USD/CHF: 1.002064
• Third Key resistance level of USD/CHF: 1.006522
• First key support level of GBP/USD: 1.125538
• Second Key support level of GBP/USD: 1.108687
• Third Key support level of GBP/USD: 1.092532
• First key resistance level of GBP/USD: 1.140898
• Second Key resistance level of GBP/USD: 1.148472
• Third Key resistance level of GBP/USD: 1.15876
• First key support level of USD/JPY: 148.700
• Second Key support level of USD/JPY: 148.128914
• Third Key support level of USD/JPY: 147.155206
• First key resistance level of USD/JPY: 149.300
• Second Key resistance level of USD/JPY: 150
• Third Key resistance level of USD/JPY: 150.555
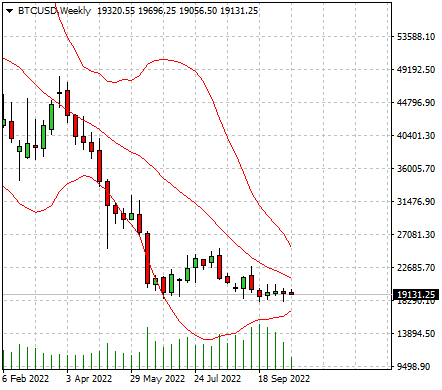
Bitcoin and preparation for a rise?!
During its recent fall, Bitcoin has slowed down its fall by reaching the resistance level of 2017 at the price level of $18,800 and is now making a floor. During this bearish trend, sellers have managed to reach the lowest price level of $18,136. Due to the traders’ doubts, the price activity has been in a neutral range during the last month, and this is well represented by the formation of candles with a small cord in the weekly time frame. In case of negative news in the crypto market or a negative external factor affecting Bitcoin, the potential price will drop further and reach the support level of $17,000 (warning to buyers in any time frame).
In the current situation, due to the fact that the price is oversold in all intervals such as monthly and weekly, the price will have the potential to correct the downward and upward trend during the next candlesticks, although this correction goes on slightly. In the daily interval, regarding buyers’ hope for the price to rise and also the withdrawal of some sellers from their transactions, (exiting sales transactions due to the price reaching the conversion level of 2017) the price has created an ideal bullish hammer pattern at the level of $18,136, which has the potential to form a price floor and a rise. In this regard, if the price rises and the current support level is reached at the level of $18,000, the buyers will look for the resistance level of $20,300 in the first stage and up to the level of $24,000 as price targets in the second stage.
CloseOption Team
www.closeoption.com


