The key support and resistance levels ahead for USD/CHF are as follows:
- R3: 0.806
- R2: 0.80000
- R1: 0.79670
- S1: 0.7928
- S2: 0.78800
- S3: 0.78300
USD/CHF and Buying Opportunities?
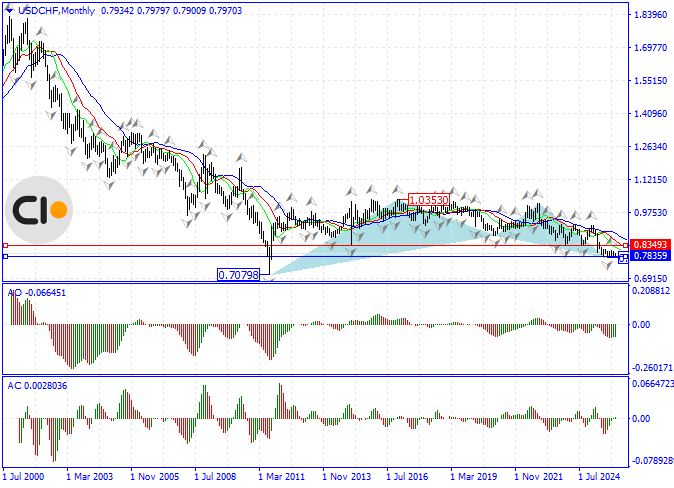
The USD/CHF currency pair has been experiencing a strong bearish trend over recent years. During this downward trajectory, sellers (bears) have successfully driven the price to a low of 0.78300 thus far.
Considering the magnitude of recent declines across long-term timeframes, such as the monthly chart, the price is currently in a deeply oversold condition, trading near the lowest rates recorded in the history of this pair.
In the monthly timeframe, we observe the formation of two Spinning Top candlestick patterns, while a Hammer pattern has emerged on the weekly chart. Consequently, the price has currently paused its further decline. The trend remains in a completely oversold state, accompanied by a divergence in the RSI indicator.
Analyzing the price action structure within the range of the 0.70798 low to the 1.03530 high, a Bullish Gartley Harmonic Pattern has formed. This formation suggests a probability of an upward reversal from the 0.78300 support zone.
On shorter timeframes, such as the daily chart, the price has initiated a bullish cycle in recent days, successfully closing above the 21-day Moving Average. Should the upward momentum continue, traders’ initial targets are set at the key level of 0.80000, followed by the resistance level of 0.80740.
Conversely, in a bearish scenario, the price would first need to break below the key level of 0.78800 and sustain a position beneath it. In such an event, the current bullish setup would be invalidated, and the price would potentially target the support levels of 0.78300 and subsequently 0.78000.


