Technical Analysis of the AUD/USD – An overview of important support and resistance levels of the four major currency pairs of the ongoing week.
• First key support level of EUR/USD: 1.053537
• Second Key support level of EUR/USD: 1.048281
• Third Key support level of EUR/USD: 1.039568
• First key resistance level of EUR/USD: 1.069129
• Second Key resistance level of EUR/USD: 1.079085
• Third Key resistance level of EUR/USD: 1.086362
• First key support level of USD/CHF: 0.938897
• Second Key support level of USD/CHF: 0.934992
• Third Key support level of USD/CHF: 0.928825
• First key resistance level of USD/CHF: 0.942758
• Second Key resistance level of USD/CHF: 0.95
• Third Key resistance level of USD/CHF: 0.954714
• First key support level of GBP/USD: 1.191871
• Second Key support level of GBP/USD: 1.183939
• Third Key support level of GBP/USD: 1.157
• First key resistance level of GBP/USD: 1.214362
• Second Key resistance level of GBP/USD: 1.227043
• Third Key resistance level of GBP/USD: 1.244378
• First key support level of USD/JPY: 135.231649
• Second Key support level of USD/JPY: 134.055567
• Third Key support level of USD/JPY: 133.389485
• First key resistance level of USD/JPY: 136.922526
• Second Key resistance level of USD/JPY: 140
• Third Key resistance level of USD/JPY: 142.500155
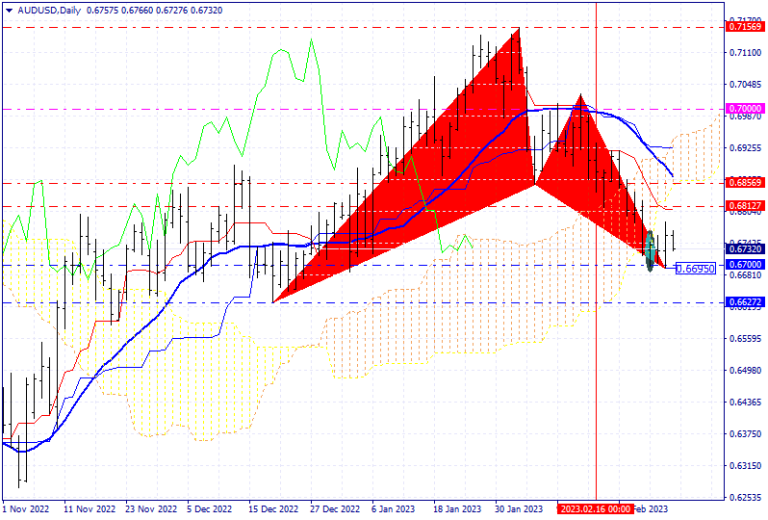
Technical Analysis of the AUD/USD currency pair on 01/03/2023.
As stated in the previous Analysis of the AUD/USD on 16/02/2023, the price could move in the indicated downward (primary mode) and upward (corrective movement) directions, finally achieving the indicated goals. During the recent downward trend, the sellers have gotten the lowest price level of 0.66950, the most critical support level before the price.
In the current situation, there is no clear and transparent reason for the price to rise in long-term intervals, such as weekly, and if the price floor of 0.66950 is lost, the price will have the potential to fall further and reach the important support level of 0.662719. (Warning for buyers with medium-term transactions).
In the daily time frame, the price has stopped falling further during its decline by reaching the support level of the round number of 0.67000 (the sellers use this round level to close their transactions). However, a price ceiling formation and trend change will be possible with the formation of candles such as Doji and Hammer.
Between the price ceiling of 0.715686 and the price floor of 0.66950, a bat-type harmonic pattern has been formed, and when the D point of this harmonic pattern is completed, a warning and the potential of rising during the next candles are pointed out.
In shorter periods, such as 4 hours, strong movements for the price drop are observed, and the first warning for the rise occurs with the formation of a price floor and its stabilisation at this time.
In general, as long as the price floor of 0.66950 is maintained and if buyers enter and control more in the market, the price will have the potential to rise and reach the resistance levels of 0.681274 and 0.685691.
CloseOption Team
www.closeoption.com


