The key support and resistance levels ahead for BTC/USD are as follows:
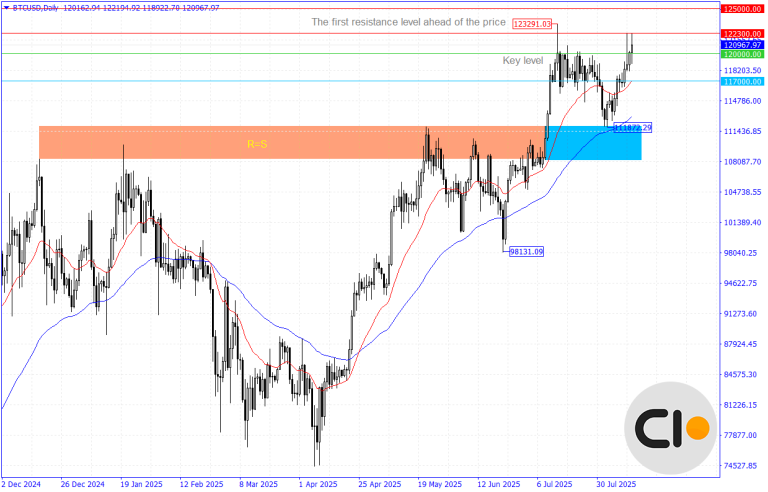
Third key resistance level of BTC/USD: 125000
Second key resistance level of BTC/USD: 122300
First key resistance level of BTC/USD: 120000
First key support level of BTC/USD: 117000
Second key support level of BTC/USD: 114600
Third key support level of BTC/USD: 112000
Shift in Focus from Bitcoin to Altcoins?
As indicated in the previous Bitcoin analysis dated July 29, 2025, the potential for a decline in the Bitcoin chart was present, which ultimately led to the designated support levels of $116,000 and $114,600 being reached. In long-term intervals, such as the monthly and weekly timeframes, the trend is still interpreted as bullish, given the price’s position within an ascending channel and the absence of negative fundamental factors.
Should the bullish formation be maintained, long-term price targets for buyers include the resistance levels of $125,000 and, in a more aggressive scenario, up to $129,000.
The value and liquidity in the cryptocurrency markets have experienced significant growth. In contrast to Bitcoin, altcoins such as Ethereum, Cardano, Solana, and Chainlink have demonstrated substantial upward movements.
Under the current conditions, due to the boom in altcoins led by Ethereum, the focus of traders has somewhat shifted away from Bitcoin as the cryptocurrency leader. Consequently, Bitcoin has thus far been unable to surpass the maximum price recorded in July.
Possible bearish scenario for Bitcoin
In a bearish scenario, although the price is in an overbought state in long-term intervals, the necessary factors for a trend reversal have not yet materialized on the chart. In this context, if the price fails to overcome the $122,300 resistance level, the probability of a price ceiling forming on the daily timeframe, followed by a correction in the chart, increases.
(Currently, the price is contending with the key level of $120,000; a price consolidation below or above this level can be considered a contributing factor in tracking the price action.)


 Traders")